|
#2
1st December 2014, 03:04 PM
| |||
| |||
| Re: UGC NET Sub Economics Solved Model Paper
You are looking for UGC NET Sub Economics Solved Model Paper, here I am giving; 1. Which of the following are the basic assumptions of cardinal utility analysis ? I. Utility is a measurable and quantifiable entity. II. Marginal utility of money changes with changes in real income. III. Utilities derived from various goods are inter-dependent. IV. The use of introspective method in judging the behaviour of marginal utility. Codes : (A) I and II are correct. (B) I and III are correct. (C) I and IV are correct. (D) I, III and IV are correct. 2. Engel Curve denotes (A) various amounts of a good which a consumer would be willing to purchase at various price levels. (B) various amounts of a good which a consumer would be willing to purchase at various income levels. (C) various amounts of a good purchased when the price of its substitutes tend to rise. (D) the relationship between income effect and substitution effect. 3. A producer is said to be operating with excess capacity (A) when he produces an output greater than that given by the minimum Average Total Cost (B) when he produces an output greater than at given by the maximum Average Total Cost (C) When he produces an output equal to that given by the minimum Average Total Cost (D) When he produces an output smaller than that given by the Minimum Average Total Cost 4. Assertion (A) : Harvey Leibenstein asserted that marginal conditions required for economic efficiency are not usually satisfied in practice. Reason (R) : People are not fully motivated towards maximization or minimization. Codes : (A) Both (A) and (R) are correct and (R) is the correct explanation of (A). (B) (A) is correct, but (R) is not correct. (C) Both (A) and (R) are correct, but (R) is incorrect explanation of (A). (D) (R) is correct, but (A) is incorrect. 5. A graphical illustration used to explain efficiency conditions and demonstrates how the allocations of some goods and resources can be improved through exchange is called (A) production possibility curves (B) social indifference curves (C) Edgeworth box diagram (D) Phillips curve UGC NET Economics Paper  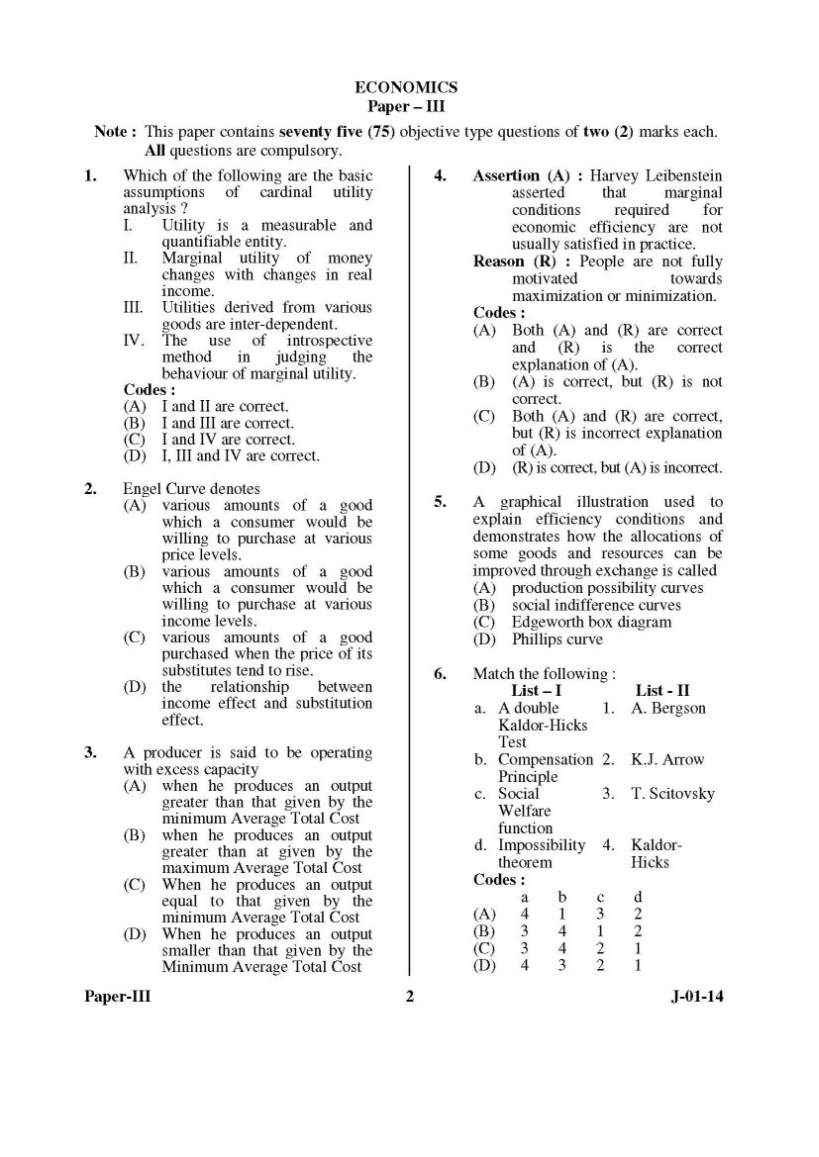 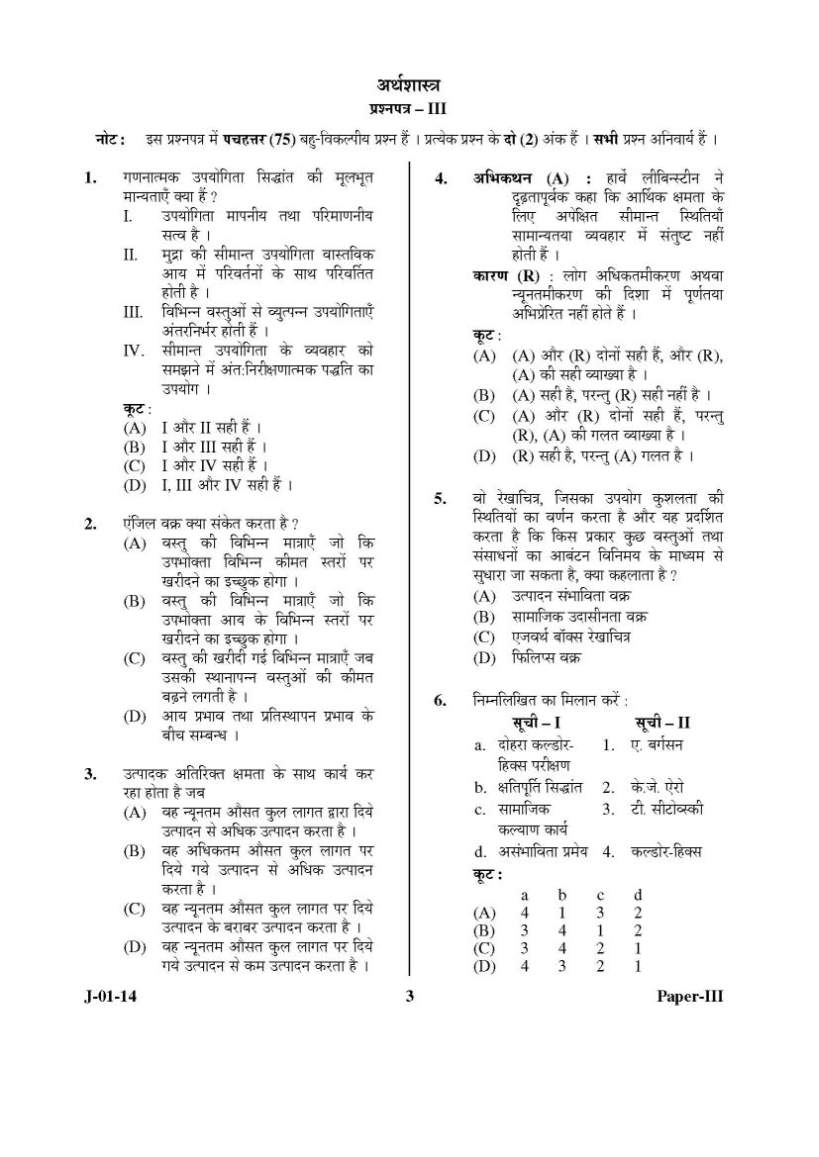  For detailed paper, here is attachment................... |