|
#2
18th August 2015, 11:31 AM
| |||
| |||
| Re: Business Statistics Bangalore University
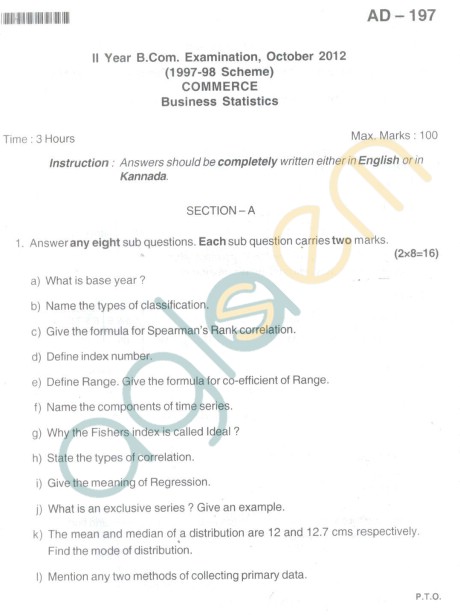
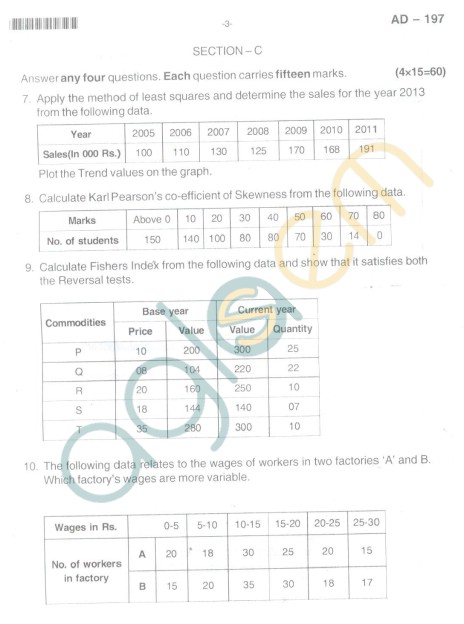
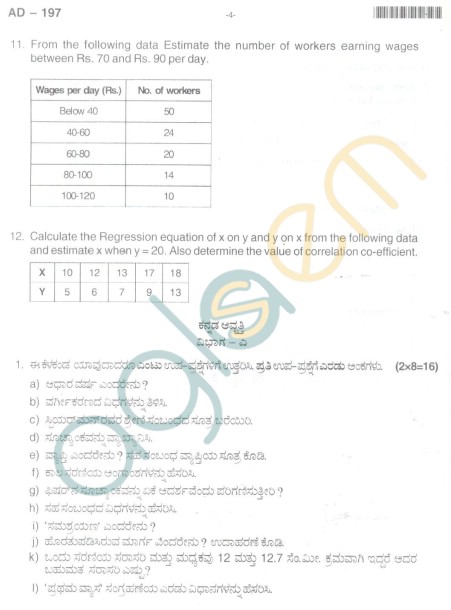
As you saying you will give Bangalore University B.com 2nd year exam and in this reference asking for Business Statistics question paper so I am sharing some old paper on your demand : Time : 3 hours Max. Marks: 90 Instruction: Answer should be written fully in English or in Kannada Section – A Answer any ten Sub-question from the following. Each sub-question carries two marks (10×2=20) 1. a. What are statistics? b. What is a current year? c. What do you mean by FRT? d. What is mean deviation? e. State the various measures of central tendency. f. State the difference between correlation and regression. g. If X- =38.2, M= 41.6, fine Z. h. What purpose does cost of living index number serve? i. If r=0.62, ?x= 10.5 ?y= 8.5, find b yx. j. Under what circumstances would it be appropriate to use median. k. What is questionnaire? l. How range is calculated. SECTION –B Answer any five questions. Each question carries 5 marks. (5X5=25) 2. In a class the number of books issued to the students form the library were as follows: No of books issued : 0 1 2 3 4 5 6 7 No of students : 7 12 10 7 6 4 3 1 Find the average number of books issued to a student of the class 3. Calculate the value of median from the following data: Marks : 1-5 6-10 11-15 16-20 21-25 No of students: 6 9 15 12 8 4. Calculate Quartile Deviation from the following date: Marks : 1-5 6-10 11-15 16-20 21-25 No of students: 6 9 15 12 8 5. Calculate mean deviation from mean of the following data: Class : 10 20 30 40 50 60 70 No of students: 4 10 20 40 48 55 60 6. Construct the consumer price index number for 2007 on the basis of 2002 from the following data using Family Budget method. Commodity Quantity consumed Price (Rs). 2002 2002 2007 A 12 20 60 B 8 40 45 C 4 70 80 D 9 70 90 E 5 20 40 F 2 200 200 7. The ranks of the 15 students in two subjects A and B are given below; the two numbers with in the brackets denoting the ranks of the same students in A and B respectively. (1,10), ( 2,7), (3,2), (4,6), (5,4), (6,8), ( 7,3), (8,1), (9,11), ( 10,15), (11,9), (12,5). (13,14), (14,12), (15,13) Find out correlation co efficient 8. Calculate standard deviation for the following data; Mid Point : 1 2 3 4 5 6 7 8 9 Frequency : 6 45 103 147 205 160 80 40 4 9. Find mode of the following series : Wages (Rs) :Below 250 250-500 500-700 750-1000 1000-1250 Above 1250 No of persons : 10 30 40 25 20 15 SECTION –C Answer any three questions. Each question carries 15 marks. (3 X 15=45) 10. Marks secured by eleven students in two subject are given below Subject A :71 66 68 67 71 70 73 70 72 66 65 Subject B :69 65 64 63 62 65 64 65 66 62 59 Calculate Karl Person’s co-efficient of correlation and the probable error. 11. The following are the runs scored by two batsman A and B in ten innings A : 101 0 27 82 36 45 13 7 65 14 B : 97 40 12 13 96 8 8 85 56 15 Who is the better run getter? Who is the more consistent batsman? 12. The following data relate to marks obtained by 250 students in accountancy and statistics in B.Com examination of a university. Subject Arithmetic mean Variance Accountancy (x) 48 16 Statistics (y) 55 25 Co-efficient correlation between marks in Accountancy and Statistics is +0.8. i) Find two regression equations ii) Estimate the marks obtained by a student in Statistics who secured 50 marks in accountancy and iii) Estimate the marks obtained in Accountancy, when marks in statics 65. 13. Find the missing frequencies if the value of median is 30.5 and N=120. Group : 20-25 25-30 30-35 35-40 40-45 45-50 50-55 55-60 Frequency : 8 15 58 ? 22 ? 4 2 14. Construct with the help of the data given below. Fisher’s Ideal Index and show how it satisfies the TRT and FRT. Commodity Base Year Current Year Price (Rs). Quantity Price (Rs) Quantity Wheat 8 75 15 80 Ghee 20 10 25 12 Fire wood 2 20 4 25 Sugar 4 10 6 14 Cloth 1 50 3 40 Bangalore University B.com Business Statistics old paper BANGALORE UNIVERSITY 2nd Semester .Bcom .Examination, May 2011 (semester scheme) COMMERCE Business Statistics [Time : 3 Hours] [Max. Marks : 90] Instruction : Answers should be written completely either in English or Kannada. SECTION-A 1. Answer any ten sub-questions. Each sub-question carries 2 marks. (10x2=20) a) Define the term statistics singularly. b) Mention the types of averages. c) What is rank correlation? d) Why Fishers index is called ideal? e) List any four methods of studying variation. f) If Z=90, median =40, find X (arithmetic mean). g) If variance =36, ?X=150, N=10, find C.V. h) If r=0.6 and N=64, find probable error. i) What is nonsense correlation? j) Mention the methods of calculating consumer price index numbers. k) How range is calculated? l) Average weight of 3 students is 60kgs. The weight of first two students is 50kg. and 60kg. respectively. Find the third student weight. SECTION-B Answer any five questions. Each question carries 5 marks. (5x5=25) 2.Find mode by grouping and analysis table. Marks 20 30 40 50 60 70 80 90 Students 40 50 70 90 85 91 89 65 3.Calculate S.D. from the following : Central size 15 25 35 45 55 65 75 85 Frequency 18 22 30 50 45 30 20 15 4.Find the class intervals if X (arithmetic mean) is found to be 35.84 and assumed mean 35. Step Deviation -3 -2 -1 0 +1 +2 +3 Frequency 2 12 19 29 20 13 5 5.If X (arithmetic mean) is found to be 44.5 find the missing frequency Weight in kgs 10 20 30 40 50 60 70 No. of Students 15 20 25 - 40 50 20 6.Calculate correlation co-efficient between density of population and death rate Density of Population 200 500 400 700 600 300 Death Rate 10 16 14 20 17 13 7.Calculate cost of living index numbered from the following data. Items Index Weights Food 323.79 50.0 Clothing 310.00 10.0 Lighting 220.00 8.0 Rent 150.00 12.0 Miscellaneous 300.00 20.0 8. From the following data : a) Calculate the regression equation X and Y. b) Estimate the value of X when Y=40. X 20 24 26 34 36 Y 10 12 14 18 26 9. Average rainfall at Gowribidanur from Monday to Saturday is 3 cm. Due to heavy rainfall on Sunday the average for the week increased to 5 cm. What was the rainfall on Sunday? SECTION-C Answer any three questions. Each question carries 15 marks. (3x15=45) 10. Ten competitors in a "Summer Fall Design Show" Gowribidanur are ranked by three Judges. Using rank correlation find out which pair of Judges have the nearest approach to the common taste in fashion design. Judge A 1 3 2 5 8 7 9 4 10 6 Judge B 3 5 4 6 7 9 8 1 2 10 Judge C 5 6 2 3 8 7 10 4 1 9 11. Wages of 100 workers are given below. If median is found to be 33, find the missing frequencies. Wages (in Rs.) 0-10 10-20 20-30 30-40 40-50 50-60 60-70 No. of Workers 12 15 - 20 - 10 10 12. Compute Fishers Ideal Index and show that it satisfies the reversability tests. Items Base year Current year Value Quantity Value Quantity A 300 150 480 4 B 50 10 90 6 C 48 12 50 5 D 120 60 100 2 E 60 20 105 3.5 13. Find from the following the most consistent Batsman and better run getter Batsman A 5 7 16 27 39 53 56 61 80 101 105 Batsman B 0 4 16 21 41 43 57 78 83 90 95 14. Find the value of mean , median and mode from the following : Weight in kgs 71-75 76-80 81-85 86-90 91-95 96-100 101-105 106-110 111-115 No. of Students 3 10 15 18 25 19 14 9 2     |