|
#2
7th August 2015, 03:30 PM
| |||
| |||
| Re: Business Statistics Important Questions Osmania University
Computer Lab - Practical Question Bank FACULTY OF COMMERCE, OSMANIA UNIVERSITY ------------------------------------------------------------------------------------------------------------ Note: Problems are to be solved by using computers (Excel/Accounting package). 1. Draw a simple bar diagram to represent the following figures relating to manufacturing of machines. Years 2000 2001 2002 2003 2004 No. of machines 1200 1700 1900 2800 2100 2. The following table gives the result of B.Com students of a college for Four year. Draw a multiple bar diagram from the following data: Year First Division Second Division Third Division 1993 10 30 50 1994 12 45 70 1995 14 50 60 1996 11 40 75 Businees Statistics Qustions 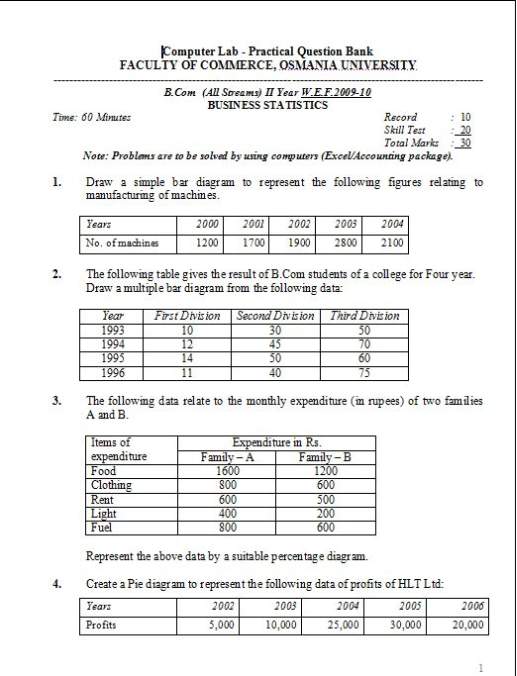     And for detailed questions download this attachment file: : Contact Details :- Address: Osmania University Main Rd, Hyderabad, Telangana 500007 Phone: 040 2768 2363 |