|
#2
9th March 2016, 03:04 PM
| |||
| |||
| Re: MBA BCG Matrix
The growth–share matrix (aka the product portfolio, BCG-matrix, Boston matrix, Boston Consulting Group analysis, portfolio diagram) is a chart that was created by Bruce D. Henderson for the Boston Consulting Group in 1970 to help corporations to analyze their business units, that is, their product lines. 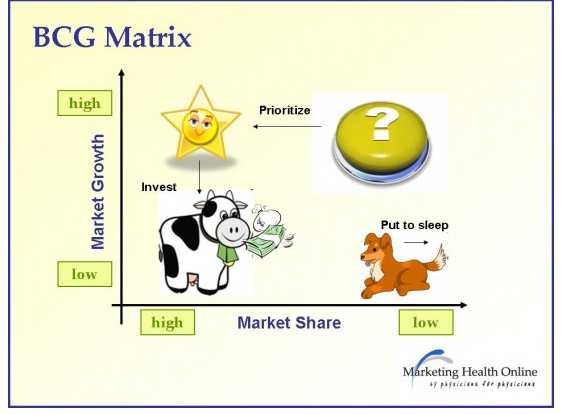 This framework assumes that an increase in relative market share will result in an increase in the generation of cash. This assumption often is true because of the experience curve; increased relative market share implies that the firm is moving forward on the experience curve relative to its competitors, thus developing a cost advantage. By investing to become the market share leader in a rapidly growing market, the business unit could move along the experience curve and develop a cost advantage. From this reasoning, the BCG Growth-Share Matrix was born. The four categories are: Dogs - Dogs have low market share and a low growth rate and thus neither generate nor consume a large amount of cash. However, dogs are cash traps because of the money tied up in a business that has little potential. Such businesses are candidates for divestiture. Question marks - Question marks are growing rapidly and thus consume large amounts of cash, but because they have low market shares they do not generate much cash. . Stars - Stars generate large amounts of cash because of their strong relative market share, but also consume large amounts of cash because of their high growth rate; therefore the cash in each direction approximately nets out. Cash cows - As leaders in a mature market, cash cows exhibit a return on assets that is greater than the market growth rate, and thus generate more cash than they consume. Under the growth-share matrix model, as an industry matures and its growth rate declines, a business unit will become either a cash cow or a dog, determined soley by whether it had become the market leader during the period of high growth. Its simplicity is its strength - the relative positions of the firm's entire business portfolio can be displayed in a single diagram. Back Points The growth-share matrix once was used widely, but has since faded from popularity as more comprehensive models have been developed. Some of its weaknesses are: Market growth rate is only one factor in industry attractiveness, and relative market share is only one factor in competitive advantage. The growth-share matrix overlooks many other factors in these two important determinants of profitability. The framework assumes that each business unit is independent of the others. In some cases, a business unit that is a "dog" may be helping other business units gain a competitive advantage. The matrix depends heavily upon the breadth of the definition of the market. |