|
#2
20th February 2017, 03:34 PM
| |||
| |||
| Re: YES Bank Technical Analysis
Well below I have given you the technical analysis for the YES Bank with the graphical representation Info is in the below format Indicator Analysis Signal (0 - 10) RSI RSI is 47.9. According to RSI analysis, yesbank is marginally weak. 4.0 MACD MACD: -2.8 and Signal Line: -7.54. According to MACD analysis, yesbank is marginally strong. 7.0 Simple Moving Average yesbank is facing resistance from it's 50-day simple moving average at 1218.075 and support level is at 1.17e+03. 7.0 Exponential Moving Average According to exponential moving average analysis, yesbank is facing resistance at 1.19e+03 and support level is at 1111.294. 3.0 Bollinger Bands %b is 0.601. 5.0 Fibonacci Retracement According to fibonacci retracement, price is above 38.2% level. Support is at 1178.3687. Resistance levels are 1204.075 and 1229.7813. 3.0 GRAPH 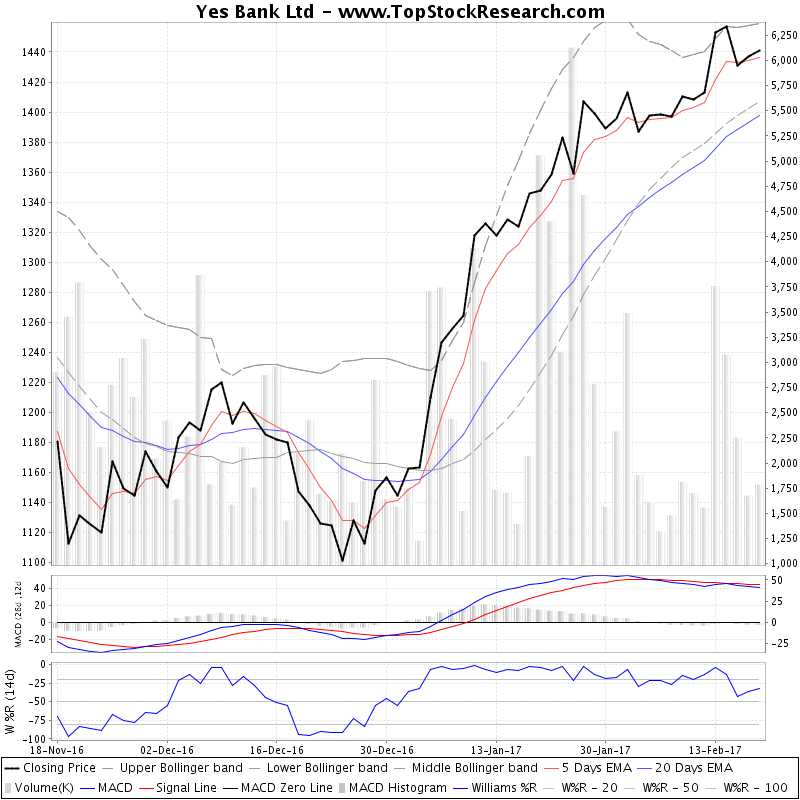 |