|
#2
14th June 2016, 10:11 AM
| |||
| |||
| Re: Pie Charts For Cat Exam
As you want to know about the Pie Chart for cat exam so the details provided below: Pie Chart A pie chart is a circle graph divided into pieces, each displaying the size of some related piece of information. Pie charts are used to display the sizes of parts that make up some whole. In a pie chart, the arc length of each sector (and therefore its central angle and area), is proportional to the quantity it represents. Together, the sectors create a full disk Pie chart examples with questions and answers Here examples are provided in the pie chart-data interpretation with easy questions along with the answers. 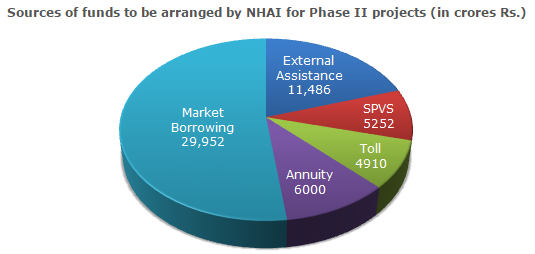 1. Through which 20% of the funds are to be arranged? Solutions: 20% of the funds = 20% of 57600 crores. = Rs. 11520 crores Approximately it is 11486, so it is arranged through External assistance. 2. Find the central angle which is equivalent to the market borrowing? Solutions: Central angle which is equivalent to the market borrowing is = (29952/57600)*360 degree = 187.2 degree |