|
#2
30th June 2016, 06:06 PM
| |||
| |||
| Re: ONGC Yahoo Chart
The details of the hare prices for the Oil and Natural Gas Corporation for both BSE & NSE has been mentioned below: Oil & Natural Gas Corporation Ltd. - NSE 218.50 Up 0.15(0.07%) 3:29pm Prev Close: 218.35 Open: 218.00 Bid: 218.50 Ask: N/A 1y Target Est: N/A Beta: N/A Next Earnings Date: N/A Day's Range: 214.20 - 219.55 52wk Range: 187.75 - 320.30 Volume: 2,967,431 Avg Vol (3m): 3,722,400 Market Cap: 1,869.20B P/E (ttm): 13.23 EPS (ttm): 16.51 Div & Yield: N/A (N/A) Oil & Natural Gas Corp Ltd – BSE 217.80 Down 0.45(0.21%) 3:54pm Prev Close: 218.25 Open: 218.25 Bid: N/A Ask: N/A 1y Target Est: N/A Beta: N/A Next Earnings Date: N/A Day's Range: 214.60 - 218.90 52wk Range: 188.00 - 320.15 Volume: 281,808 Avg Vol (3m): 424,308 Market Cap: 1,863.39B P/E (ttm): 13.19 EPS (ttm): 16.51 Div & Yield: N/A (N/A) Chart Details: 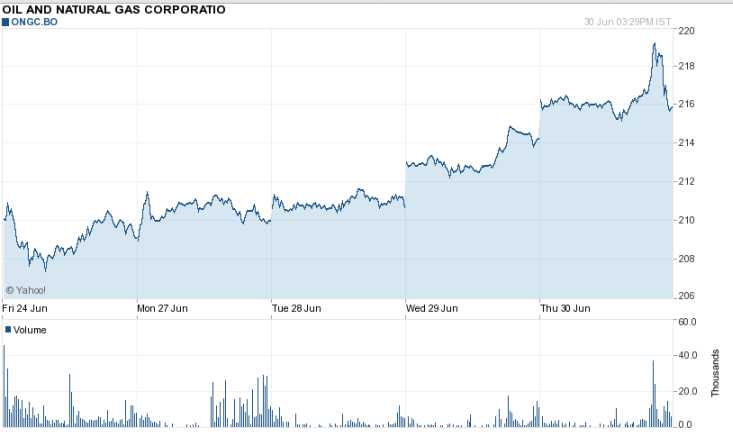 |