|
#2
24th June 2016, 05:16 PM
| |||
| |||
| Re: ONGC at A Glance
Hey!!! Oil and Natural Gas Corporation is an oil and gas company of India, as you want to get Performance at a Glance of the Annual Report of 2011-12 of this Company so here I am attaching an attachment that contain the information related to that Information in this Attachment Contain the following: PHYSICAL Quantity Sold (Other than Trading) Crude Oil (MMT) Natural Gas (MMM3) -LPG (000'Tonnes) -Naptha/ARN (000'Tonnes) -Ethane/Propane (000'Tonnes) -Superior Kerosene Oil (000'Tonnes) Quantity Sold (Trading) -Superior Kerosene Oil (000'KL) -HSD (000'KL) -Motor Spirit (000'KL) FINANCIAL Revenue from Operations Other Non Operating Income Total Revenues Statutory Levies Operating Expenses Exploration Costs written off # Purchases Profit Before Interest, Depreciation & Tax (PBIDT) Depreciation, Depletion, Amortisation and Impairment Profit Before Interest & Tax (PBIT) Interest Payments Profit before Tax and Exceptional Items Exceptional items Profit before Tax Corporate Tax Net Profit (PAT) Dividend Tax on Dividend Share Capital Reserve & Surplus Net Worth (Equity) Borrowings Working Capital Capital Employed Internal Resources Generation Plan Expenditure Contribution to Exchequer Expenditure on Employees Number of Employees FINANCIAL PERFORMANCE RATIOS PBIDT to Turnover (%) PBDT to Turnover (%) Profit Margin(%)- incl. exceptional item Contribution to Exchequer to Turnover (%) ROCE (PBIDT to Capital Employed) (%) Net Profit to Equity (%)- incl. exceptional item BALANCE SHEET RATIOS Current Ratio Debt Equity Ratio Debtors Turnover Ratio(Days) PER SHARE DATA Earning Per Share (Rs) Dividend (%) Book Value Per Share(Rs) Performance at a Glance of the Annual Report of 2011-12 of Oil and Natural Gas Corporation 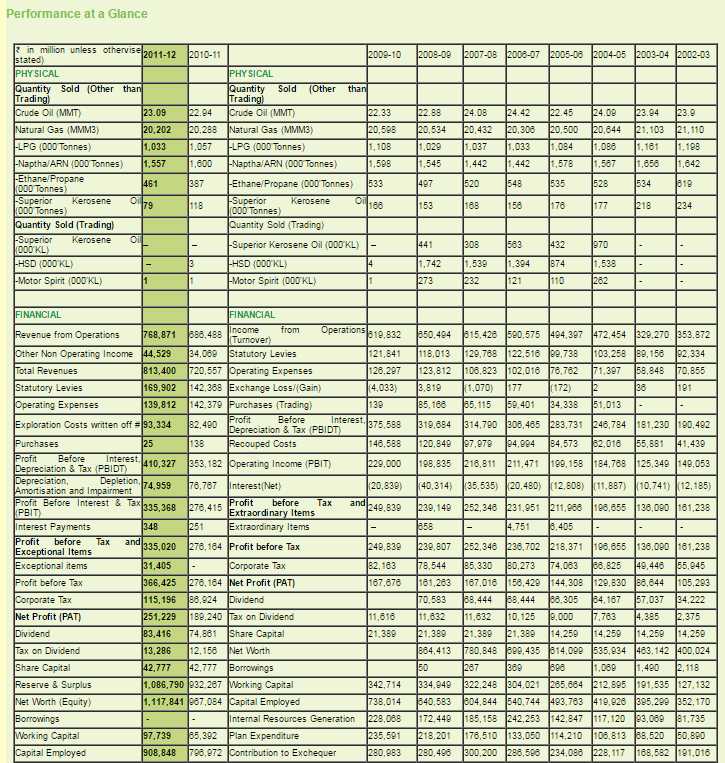 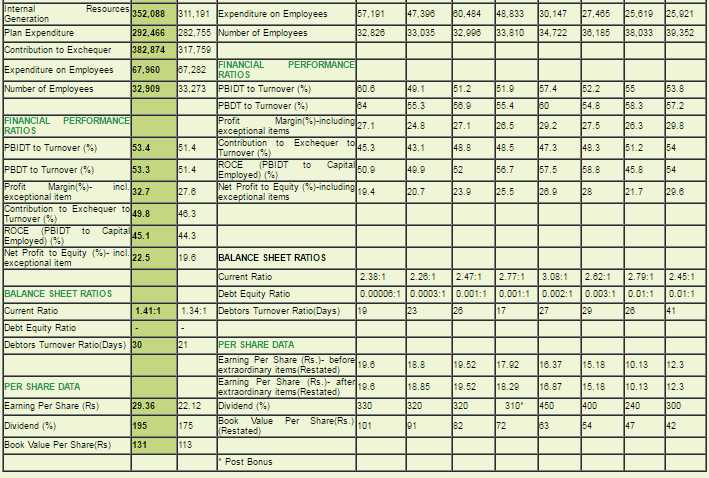 |