|
#2
20th December 2016, 11:56 AM
| |||
| |||
| Re: EOD Chart Of SBI
The state bank of India is provides a EOD chart to its customers. The state bank of India is updating daily changes in bank services and decisions. As you want here I’m giving you a image which is show you detail of char of EOD. EOD chart of State bank of India: 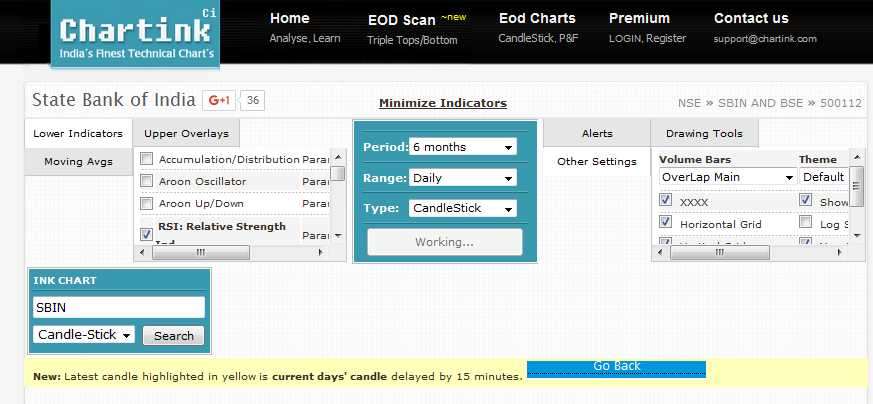 l lCash Price (18/11/2016) Open High Low -1.65 278.15 280 274.85 -0.59% LTP Pr.Close VWAP 275.8 277.45 276.99 Futures Price: Open High Low -2.4 278.3 280 275.05 -0.86% LTP Pr. Close OI 275.85 278.25 65535000 SBIN Price Low : 274.85 High : 280 SBIN 52 Week's Low & High Low : 148.25 High : 288.8 SBIN Returns(%) Weekly Returns: 1.03 % Monthly Returns: 6.69 % Quarterly Returns: 6.69 % Yearly Returns: 13.52 % SBIN Trend Analysis 200 EMA(%): 17.539 50 EMA(%): 7.285 20 EMA(%): 4.191 |